
Databento#
What Is Databento?#
Databento is an API-first market data platform that provides programmatic access to exchange-level tick data, order book snapshots, and OHLCV bars. Unlike Bloomberg (which centers on a desktop terminal) or LSEG Datastream (which is accessed via WRDS web queries), Databento is designed from the ground up for developers and quantitative researchers who want to pull data directly into code.
Key differentiators:
Programmatic access: Python SDK, HTTP API, and raw TCP — no terminal or GUI required.
Exchange-level granularity: Tick-by-tick trades, L2/L3 order book, and time-bar aggregations from 1-second to daily.
Pay-as-you-go pricing: Check the exact dollar cost of any query before executing it, for free.
Self-service: No sales calls or license negotiations.
UChicago has a Databento subscription for FINM students, providing access to CME Globex (GLBX.MDP3) — the electronic trading venue for E-mini S&P 500 futures, Treasury futures, and other major derivatives (including the options on those futures).
One licensing detail matters in practice: the course subscription is a flat-rate license for GLBX.MDP3 only. Queries against that dataset cost $0.00, while every other Databento dataset — for example OPRA, the consolidated feed for listed equity options like SPX/SPXW — bills pay-as-you-go per query. This is exactly why the HW 4 case study extends its S&P 500 option panel with CME E-mini options on futures (free under the subscription) rather than SPX index options from OPRA (metered).
Discussion
How does the pricing model for Databento (pay-per-query) compare to Bloomberg (terminal subscription) and LSEG Datastream via WRDS (institutional license)? What are the implications for a research project that requires one-time bulk historical pulls versus ongoing daily updates?
See also
Everything on this page is also available as a single executed notebook, Pulling Market Data From Databento, which walks through the SDK, the raw HTTP API, symbology and schemas, and the Treasury futures market brief with live output.
Key Concepts: Datasets, Schemas, and Symbology#
Before writing any code, it helps to understand three organizing concepts in the Databento data model.
Datasets#
A dataset identifies a trading venue. The primary dataset for this course is:
Dataset |
Venue |
Products |
|---|---|---|
|
CME Globex |
E-mini S&P 500, Treasury futures, Eurodollars, and more |
Symbology#
Databento supports multiple ways to refer to the same instrument. This flexibility is essential when working with futures, which have expiring contracts:
Symbology Type |
Example |
Description |
|---|---|---|
|
|
One specific contract (ES = E-mini S&P, U = Sep, 4 = 2024) |
|
|
All active expirations of a product |
|
|
All listed series of an options-on-futures product (here: E-mini S&P 500 end-of-month options — used in HW 4) |
|
|
Rolling front-month contract |
|
|
Numeric exchange-assigned ID |
Two options-on-futures quirks worth knowing before HW 4: an option’s raw
symbol (e.g. EW1N3 C4580) names the series, right, and strike but not the
expiration date — that comes from the exchange’s listing rule or its
definition records — and parent-symbol queries also return user-defined
spreads (raw symbols starting UD:), multi-leg strategies that must be
filtered out of an outright-options panel.
For quick reference, here are the futures month codes:
Code |
Month |
Code |
Month |
|---|---|---|---|
F |
January |
N |
July |
G |
February |
Q |
August |
H |
March |
U |
September |
J |
April |
V |
October |
K |
May |
X |
November |
M |
June |
Z |
December |
Schemas#
A schema controls the level of detail (and volume) of the data returned. Schemas form a hierarchy from most to least granular:
Schema |
Description |
|---|---|
|
Market-by-order (every order book event) |
|
Market-by-price, 10 levels |
|
Market-by-price, top of book |
|
Every individual trade (tick-by-tick) |
|
1-second bars |
|
1-minute bars |
|
1-hour bars |
|
Daily bars |
More granular schemas produce more data (and cost more). For most research
projects, trades or ohlcv-1m are good starting points.
See the
03_schemas_and_symbology
module in the examples repo for runnable comparisons.
Getting Started with the Python SDK#
Installation#
pip install databento python-dotenv
API Key Setup#
Create a .env file in your project root with your Databento API key:
DATABENTO_API_KEY=db-XXXXXXXXXXXXXXXXXXXX
Warning
Never commit your .env file to version control. Make sure .env is in your
.gitignore.
Your First Query#
The pattern for every historical query is: create client → check cost → fetch data → convert to DataFrame.
from dotenv import load_dotenv
import databento as db

load_dotenv()  # reads DATABENTO_API_KEY from .env

client = db.Historical()

# --- Query parameters ---
query = dict(
    dataset="GLBX.MDP3",
    symbols=["ES.FUT"],
    stype_in="parent",
    schema="trades",
    start="2024-08-01",
    end="2024-08-02",
    limit=10,
)

# Step 1: Check cost (free metadata call)
cost = client.metadata.get_cost(**query)
print(f"Estimated cost: ${cost:.4f}")

# Step 2: Fetch data only if the cost is acceptable
data = client.timeseries.get_range(**query)

# Step 3: Convert to pandas DataFrame
df = data.to_df()
print(df)
Warning
Always check client.metadata.get_cost() before calling get_range().
Queries against tick-level schemas over long time ranges or many symbols can
become expensive. The cost check is free and returns the exact dollar amount.
Historical vs. Live Data#
Databento provides two modes of access:
Historical: Pull archived data for backtesting and research via
db.Historical(). Billed per query based on data volume.Live: Stream real-time data as it arrives from the exchange via
db.Live(). Billed per subscription.
Here is a minimal live streaming example. Read it for contrast only — we do not have a live license for this course, so this code will not run (see the warning below):
import databento as db
from dotenv import load_dotenv

load_dotenv()

client = db.Live()

client.subscribe(
    dataset="GLBX.MDP3",
    schema="trades",
    stype_in="parent",
    symbols="ES.FUT",
)

for record in client:
    print(record)  # each record is a TradeMsg with auto-scaled prices
Warning
We do not have a live-data license for this course. Live access is licensed separately from historical access, and our subscription covers historical only. Running the code above authenticates successfully and is then rejected:
BentoError: A live data license is required to access GLBX.MDP3.
That is an entitlement message, not a bad API key — the same key keeps working
for every historical query on this page. Because we cannot run them, the class
repo has no live streaming examples; everything in it uses
db.Historical(). Treat db.Live() as background knowledge for how real-time
market data feeds work, not as something to try in this course.
Separately, live streaming also requires CME Globex to be open (Sunday 5 PM – Friday 4 PM CT, with a daily maintenance break from 4–5 PM CT).
For a deeper look at what the SDK does under the hood — raw HTTP requests, HTTP
Basic Auth, and the fixed-point integer encoding — see module
02_historical_api
in the examples repo.
Case Study: Treasury Futures Market Brief#
The
04_treasury_futures_brief
example in the class repo fetches daily OHLCV data and open interest for five
Treasury futures products spanning the yield curve:
Symbol |
Product |
Underlying |
Approx. Duration |
|---|---|---|---|
|
2-Year T-Note |
UST 2Y |
~1.9 years |
|
5-Year T-Note |
UST 5Y |
~4.2 years |
|
10-Year T-Note |
UST 10Y |
~6.5 years |
|
Ultra 10-Year T-Note |
UST 10Y (ultra) |
~9.5 years |
|
30-Year T-Bond |
UST 30Y |
~17 years |
Indexed Price Series#
The chart below normalizes each product’s closing price to 100 at the start of the sample and tracks relative performance. Products with longer duration (ZB, TN) show larger price swings — exactly what we expect given the inverse relationship between bond prices and yields.
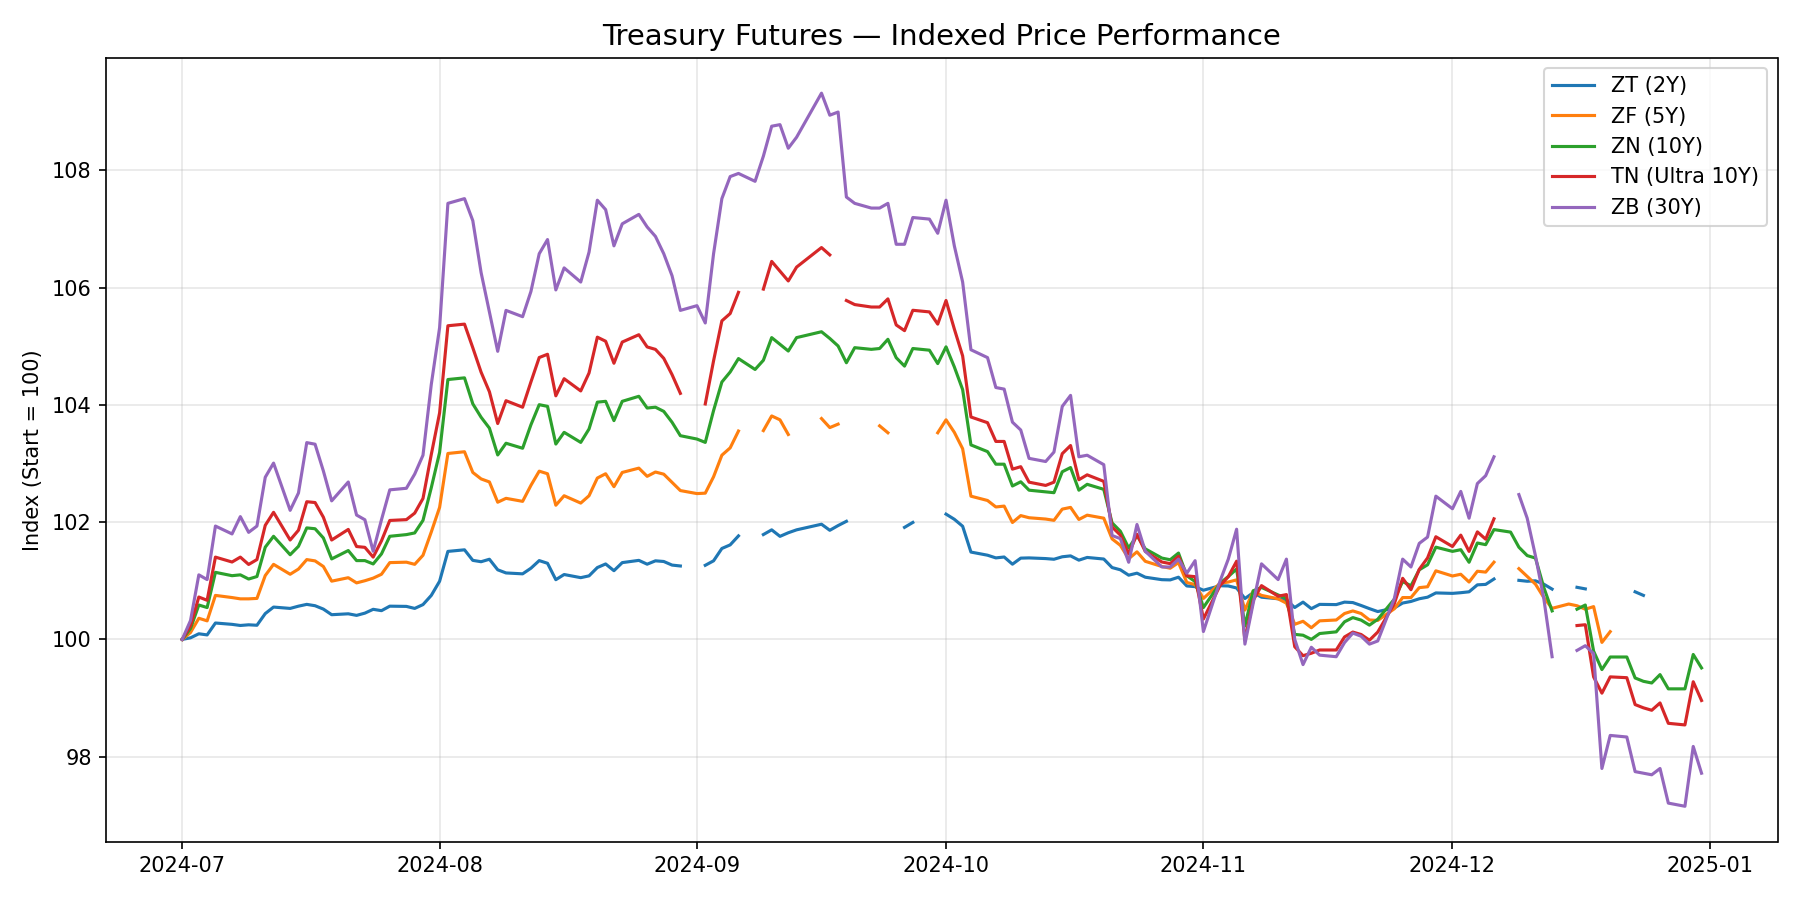
Fig. 4 Indexed closing prices (base = 100) for five Treasury futures products.#
Volume and Open Interest#
Volume and open interest reveal where liquidity concentrates, and the two metrics do not agree. The 10-Year T-Note (ZN) dominates volume — it turns over the most contracts per day, which is why it is the benchmark for Treasury futures trading. But open interest is highest in the 5-Year (ZF), because positions there are held rather than traded. Volume measures flow; open interest measures the stock of positions outstanding.
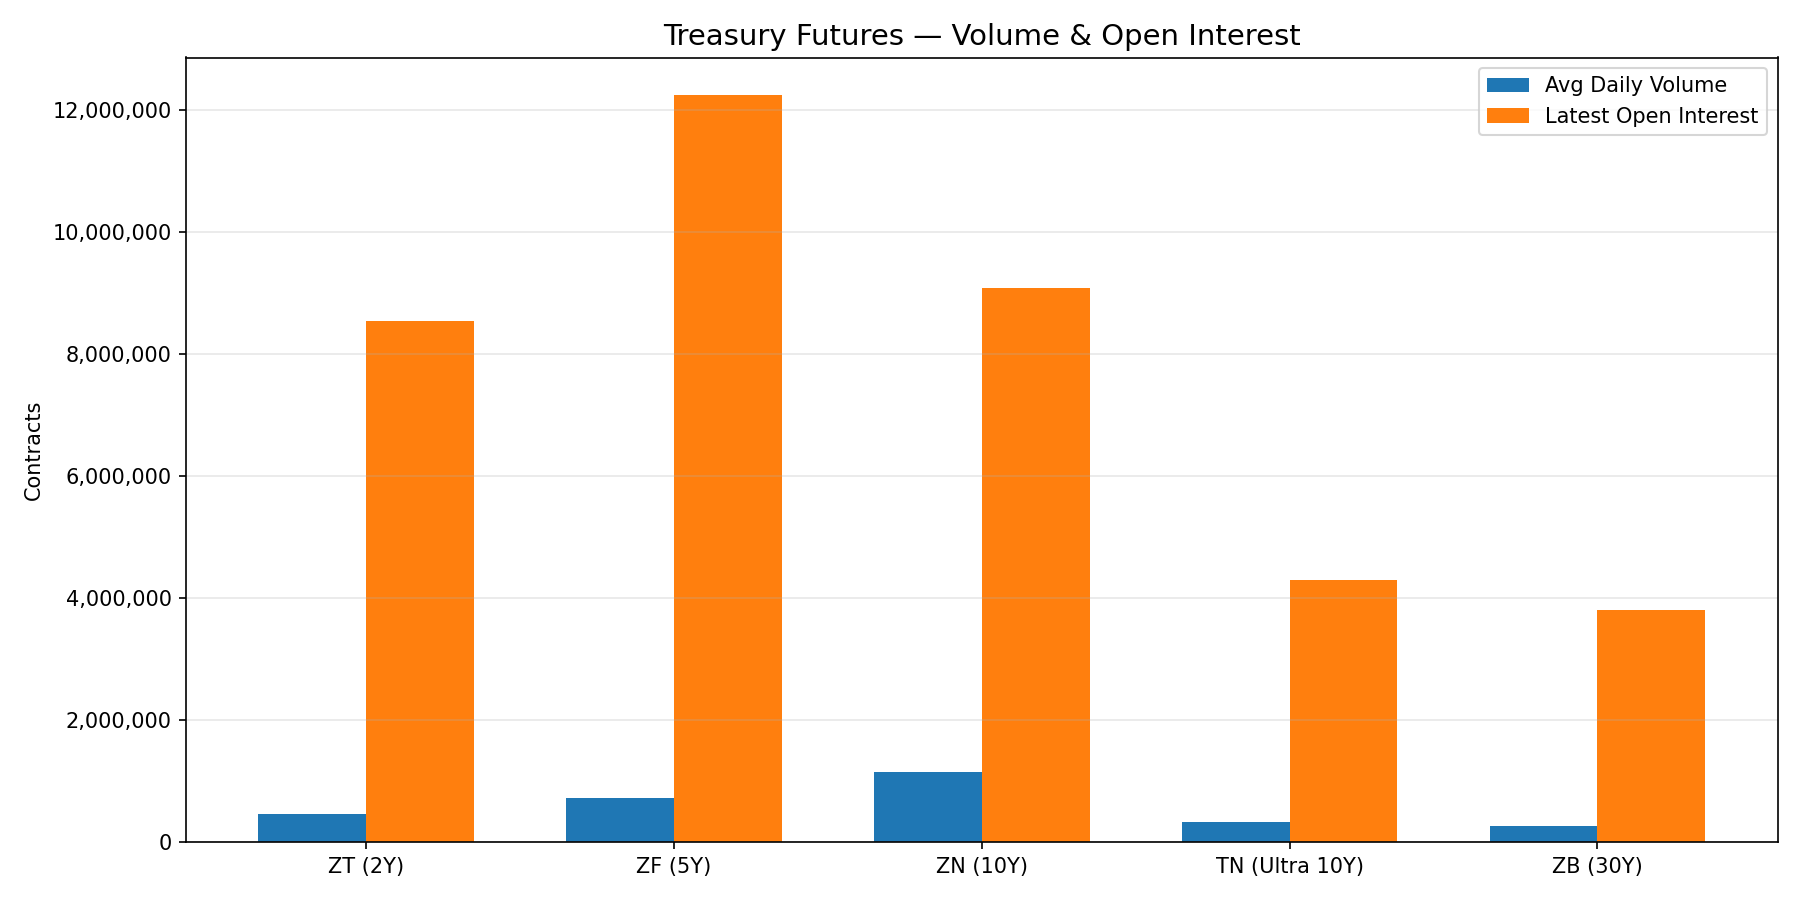
Fig. 5 Average daily volume and open interest across Treasury futures products.#
Tip
Try it yourself. Clone the
examples repo
and run the 04_treasury_futures_brief scripts to reproduce these charts, add
new products, or extend the date range.
Comparing Data Sources#
Discussion
Bloomberg |
LSEG Datastream (WRDS) |
Databento |
|
|---|---|---|---|
Access |
Desktop terminal + Excel API |
Web queries or Python via WRDS |
Python SDK, HTTP API, TCP |
Pricing |
Annual terminal license |
Institutional license (via WRDS) |
Pay-per-query |
Strengths |
Breadth (equities, FI, macro, news) |
Long historical coverage, cross-asset |
Exchange-level tick data, order book |
Best for |
Exploratory research, fixed income analytics |
Panel data, academic research |
Algorithmic trading, microstructure research |
Resources#
Databento Documentation — API reference, schema definitions, dataset catalog
Databento Python SDK (PyPI) — SDK installation and changelog
FINM-32900 In-Class Examples: Databento — 4 modules covering historical access (SDK and raw HTTP), schemas, symbology, and the Treasury futures case study. All historical; we have no live license.
Pulling Market Data From Databento — the four modules above merged into one executed notebook
Databento Portal — Web UI for browsing datasets, checking costs, and managing API keys