What is Full Stack Quantitative Finance? Why This Course?#
What is Full Stack Quantitative Finance?#
“Full stack quantitative finance” refers to having expertise across the entire lifecycle of financial models, from data acquisition to execution. This includes managing large datasets, developing and optimizing quantitative models, managing the necessary infrastructure, and understanding execution systems. It also involves presenting results through effective visualizations or reports. A full stack professional in this field bridges the gap between data, modeling, infrastructure, reporting, and trading systems.
While the concept of “full stack” implies a broad range of skills and most professionals will specialize in one area—whether that’s data engineering, DevOps, quantitative research, or some other area—there exists a core set of skills that are valuable to professionals in all roles. This course aims to teach this core set of skills. This course aims to teach the tools and principles behind creating reproducible and scalable workflows, including build automation, dependency management, unit testing, the command-line environment, shell scripting, Git for version control, GitHub for team collaboration, working with remote machines for high-performance computing and big data analysis, and deployment of financial models and dashboards. My hope is that these tools will serve as a technical foundation for any subfield of financial computing or data science that the student wishes to pursue.
Objectives#
Financial data is central to all quantitative finance workflows. And given the increasing complexity of such workflows and the challenges associated with working with large data sets, understanding of the full stack is valuable to professionals in all roles. For this reason, it is my belief that the core set of skills involved in full stack quantitative finance are important for students in either financial computing or data science. As a matter of fact, since I focus on teaching the tools and principles behind creating reproducible and scalable workflows, I derive the inspiration for this course from the definition of “data science.” From this definition, I identify two objectives for this course:
The “Science” in Data Science. Teach a core set of software tools and principles behind creating modern data analytic workflows that are reproducible and scalable from end to end. The idea is that this set of computational tools will serve as a technical foundation for any subfield of data science that the student wishes to pursue. This is born out of the idea that reproducibility is fundamental to good science.
The “Data” in Data Science. Give students hands-on experience with a series of important and commonly used financial data sets and/or sources, including CRSP, Compustat, FRED, BEA data, FINRA TRACE, TreasuryDirect, EDGAR, and NYSE TAQ. Not only does each data set require some degree of domain specific knowledge (e.g., to clean and interpret properly), but each data set also poses different computational challenges to use effectively. For example, using EDGAR means working with large amounts of unstructured text or data from NYSE TAQ involves learning to work with big data (approximately 100 GBs per day). Each case study is designed to give students the basic knowledge and tools to use these data sets effectively.
Motivation#
The Full Stack Core Skill Set: A Bridge Between Financial Computing and Data Science#
Given the increasing complexity of the computational sciences, the ability to produce readable, reusable, and reproducible code and analyses is increasingly important for backend developers and also for researchers looking to produce good science and to add value within an organization. The core set of skills taught in this course are those that I believe bridge the gap between financial computing and data science. Specifically, they are those that make up the elements of the analytical pipeline (e.g., reproducible analytical pipelines): from data extraction and cleaning to exploratory analysis, visualization, and modeling, and finally, publication and deployment. This course aims to teach the tools and principles behind creating reproducible and scalable workflows, including build automation, dependency management, unit testing, the command-line environment, shell scripting, Git for version control, and GitHub for team collaboration. Furthermore, given that this course is aimed towards students studying quantitative finance, these tools are taught through a series of case studies that are designed to give students practical experience with key financial data sets and sources, such as CRSP and Compustat for pricing and financials, macroeconomic data from FRED and the BEA, bond transactions from FINRA TRACE, Treasury auction data from TreasuryDirect, textual data from EDGAR, and high-frequency trade and quote data from NYSE.
How does this relate to data science? A common characterization of data science describes it as a combination of coding/computer skills, mathematics and statistics, and domain specific knowledge (see the following figure).
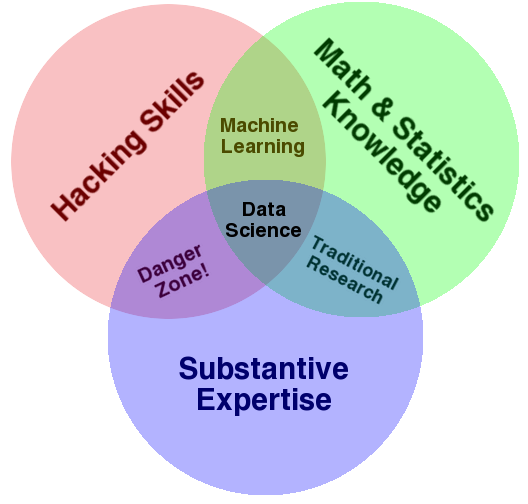
These computer skills, colloquially referred to as “hacking skills,” are called such because they refer to skills that are often not taught in a traditional computer science curriculum. A computer science curriculum might include theoretical courses on algorithms, operating systems, or programming languages, whereas the practical skills related to the computing ecosystem—the command-line environment, shell scripting, data wrangling and visualization, or version control—are often left to the individual to learn on their own. (This was even the motivation for a supplementary CS course at MIT, “The Missing Semester of Your CS Education.”) In this course, I provide a structured overview of these important tools and demonstrate, by example, how they can be used to (1) collect, clean, and analyze economic and financial data; (2) facilitate collaboration among groups of researchers; and (3) to create analyses that are easy for outside users to reproduce. All of the examples and/or case studies used to illustrate these concepts and to teach these tools come from common tasks or applications within quantitative finance, including data wrangling, feature engineering, time series forecasting, performance evaluation, portfolio optimization, back testing, and reporting results.
An Aside On The Data Science And This History Of Science#
The concept of reproducibility has been a cornerstone in the development of the scientific method and, by extension, the broader history of science. Reproducibility refers to the ability of an experiment or study to be repeated with similar results by different researchers, using the same methods under the same conditions. This principle is crucial for validating the reliability and universality of scientific findings.
As an example, consider the accomplishments of the historical astronomer Galileo Galilei. Galileo’s work exemplifies how reproducible findings are fundamental for advancing scientific knowledge and challenging established theories. In the early 17th century, Galileo improved the design of the telescope and made astronomical observations that challenged the prevailing geocentric model, which placed the Earth at the center of the universe. He observed, among other things, the moons of Jupiter and the phases of Venus. These observations were reproducible in the sense that other scientists could and did construct similar telescopes to see the same phenomena. This reproducibility was crucial for the acceptance of the heliocentric model, which posits the Sun at the center of the solar system.
Discussion
What are ways in which principles of reproducibility in the hard sciences might be reflected in data science?
Which Full Stack “Tools”?#
This course focuses on a specific set of skills and tools. It is not necessarily a course about methodologies or statistical concepts. Rather, it is a set of tools that is applicable to a wide range of topics that you might study within the field of data science or in financial computing. And, as described previously, these tools are designed to improve reproducibility, help enable better collaboration within teams of increasing size, and allow researchers to handle increasingly complex workflows.
Command-Line Environment (Example: Bash and the Linux/Unix Command Line Environment)
Command-line proficiency is crucial for programmers as it enables the automation of repetitive operations through powerful scripting, and provides access to a suite of advanced development tools and utilities. It’s especially important in fields like data science and finance, where direct manipulation of the environment and remote server management are often required. Additionally, command-line skills are a standard industry expectation, integral to effective development and system administration.
Shells and Shell Scripting (Example: Bash and Bash Scripting)
Bash is the default shell for many Linux distributions. Bash scripting in Linux allows for automating repetitive tasks. This is particularly useful in quantitative finance for automating data retrieval, preprocessing, and analysis tasks, increasing efficiency and reducing the potential for human error.
Build/Task Automation (Example:
MakeorPyDoit)Makeis a build automation tool that automatically builds executable programs and libraries from source code. PyDoit is similar to make, but offers a more Pythonic approach to task automation and dependency management, with capabilities like defining tasks in pure Python and better handling of file dependencies and Python functions. Such tools are essential for quantitative finance researchers because it streamlines the compilation and testing of financial models, ensuring efficient and consistent builds, particularly in complex Python-based projects.
Working with Remote Machines (Example: SSH)
SSH, or Secure Shell, is a protocol used to securely access and manage remote systems. For data scientists, SSH is crucial for tasks like running computations on remote servers, accessing cloud-based data storage, or managing virtual machines. Its secure nature ensures safe transmission of sensitive data, which is a common requirement in data science projects, particularly those involving confidential financial or personal data. This makes SSH an indispensable tool for working efficiently in distributed computing environments and for executing tasks on remote machines without compromising security.
Discussion
How many people here have used the Linux command line before? How often? Do you feel comfortable with it? How about Make or ssh?
HPC Workload Manager (Example: SLURM)
SLURM (Simple Linux Utility for Resource Management) is a highly configurable open-source workload manager designed for Linux clusters of any size. It’s critical for data scientists working in high-performance computing (HPC) environments, as it efficiently schedules and manages computational jobs. In the context of data science, especially in fields like quantitative finance that require intensive computations, SLURM is invaluable for optimizing resource utilization, managing job queues, and ensuring that large-scale data processing tasks are executed effectively and efficiently. This contributes to enhanced productivity in processing large datasets and complex computational tasks, crucial for advanced data analysis and financial modeling.
Package and Dependency Management (Example: pip)
pipis the standard package manager for Python, used for installing and managing Python libraries from the Python Package Index (PyPI).pipis essential for efficiently adding and updating Python libraries. Conda is capable of handling non-Python dependencies as well, while pip is specifically a Python package manager, focusing on installing and managing Python libraries.
Virtual Environments (Example: Conda Environments)
Conda environments specialize in managing and isolating project-specific dependencies, including both Python and non-Python packages. In the realm of quantitative finance, this is invaluable as it allows for the creation of distinct, reproducible environments for different financial models or analyses, preventing conflicts between project dependencies and ensuring consistent results. Some similar tools are
virtualenvorpipenv.
Unit Testing (Example: pytest)
pytest is a framework that makes it easy to write simple and scalable test cases for Python code. In quantitative finance, accurate and reliable unit testing with pytest is crucial to ensure that financial models and algorithms perform as expected under various scenarios. Unit tests are crucial in more complex coding environments and when working in teams. For complex projects, unit tests are a way to give yourself confidence that your code is correct. It is also important for proving to others that your code is correct and that it doesn’t break when changes in other parts of the codebase are made.
Documentation Generation (Example: Sphinx)
Sphinx is a tool that makes it easy to create intelligent and beautiful documentation for software projects, particularly written in Python. Good documentation is crucial for ensuring that complex data models and algorithms are understandable and usable by others, enhancing collaboration and the long-term usability of the work. Sphinx supports various output formats, integrates with version control systems, and can automatically generate documentation from source code, making it a fundamental tool for maintaining clear and effective documentation in data science projects. For example of the output, see here.
Version Control (Example: Git)
Git is a version control system crucial for managing code in development, regardless of whether you’re working alone or in a team. It enables efficient tracking and management of code changes, facilitates easy collaboration with others, and provides a safety net to revert to previous versions if needed. Moreover, it’s a cornerstone of modern software development, crucial for maintaining organization and consistency in code projects, especially as they grow in complexity.
Collaborative Coding Platforms (Example: GitHub)
GitHub is a platform for hosting and collaborating on Git repositories. For data scientists, GitHub is essential for collaborative development, code review, and project management, especially when working on team-based projects. It can also serve as a valuable resource for code sharing, learning from the wider programming community, and showcasing one’s work, making it an essential tool for personal and professional development in coding.
Motivation#
Within the context of the academic economics research, these processes have received much more attention over the last decade. I refer to the following motivation by economists Matthew Gentzkow and Jesse M. Shapiro in “Code and Data for the Social Sciences: A Practitioner’s Guide”:
Though we all write code for a living, few of the economists, political scientists, psychologists, sociologists, or other empirical researchers we know have any formal training in computer science. Most of them picked up the basics of programming without much effort, and have never given it much thought since. Saying they should spend more time thinking about the way they write code would be like telling a novelist that she should spend more time thinking about how best to use Microsoft Word. Sure, there are people who take whole courses in how to change fonts or do mail merge, but anyone moderately clever just opens the thing up and figures out how it works along the way. This manual began with a growing sense that our own version of this self-taught seat-of-the pants approach to computing was hitting its limits…
Here is a good rule of thumb: If you are trying to solve a problem, and there are multi-billion dollar firms whose entire business model depends on solving the same problem, and there are whole courses at your university devoted to how to solve that problem, you might want to figure out what the experts do and see if you can’t learn something from it. This [course] is about translating insights from experts in code and data into practical terms for empirical social scientists.
Within the finance industry, I’ve seen statements such as the following (see here and here):
We have been in financial data science long enough, when it was called quantitative finance, to see some clear patterns that we believe are detrimental to the career of a financial data scientist: lack of fundamental core knowledge in computer science, lack of SQL knowledge, … lack of visualization abilities to share business insights… Technical knowledge is, in itself, not what’s most important; it’s an understanding of technical functions within a production environment that truly prove a candidate’s worth… Data scientists can be super smart, but if no lines of their code will go into production, it’s a waste of talent.
This course is designed to explore the core tools and techniques of data science, with an emphasis on the modern software tools and techniques that make such messy, large-scale projects not only feasible, but also easy to reproduce and reuse. This includes shell scripting, build automation, dependency management, unit testing, version control with Git, and effective collaboration with GitHub. We will explore these tools from the perspective of a quantitative researcher or data scientist working in finance, drawing on real-world applications from finance and economics, with an emphasis on hands-on work with actual data sets.
The Missing Semester of Your CS Education#
This class, focusing on this list of tools, is inspired by a great course taught by members of the Computer Science Department at MIT called “The Missing Semester of Your CS Education”. They motivate their course as follows:
Classes teach you all about advanced topics within CS, from operating systems to machine learning, but there’s one critical subject that’s rarely covered, and is instead left to students to figure out on their own: proficiency with their tools. We’ll teach you how to master the command-line, use a powerful text editor, use fancy features of version control systems, and much more!
Students spend hundreds of hours using these tools over the course of their education (and thousands over their career), so it makes sense to make the experience as fluid and frictionless as possible. Mastering these tools not only enables you to spend less time on figuring out how to bend your tools to your will, but it also lets you solve problems that would previously seem impossibly complex.
I highly recommend taking some time to browse their website and read more about their motivation here.